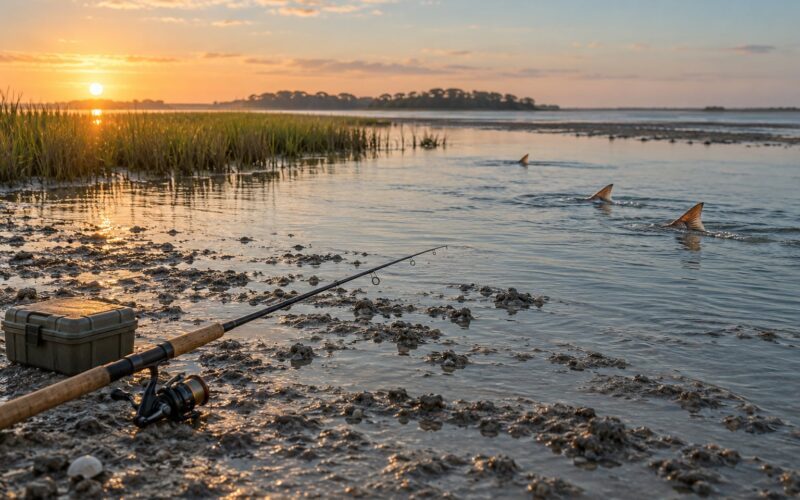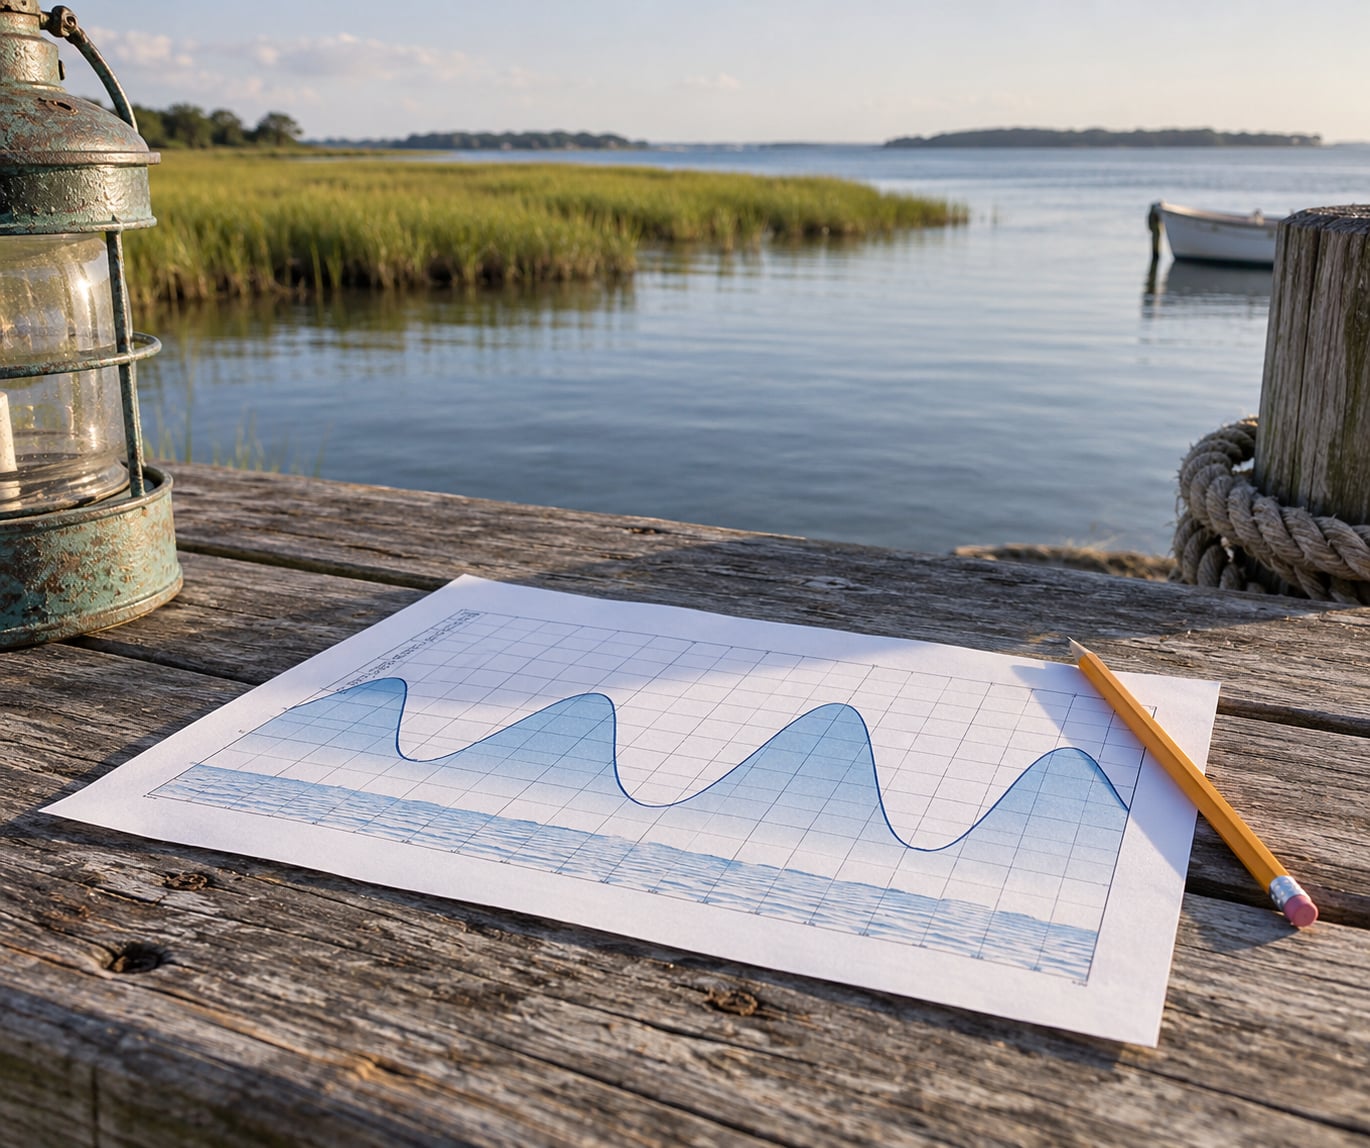
A tide chart is a graph of predicted water level for one reference station: hours run along the bottom, tidal height in feet runs up the sides, peaks are high tides and troughs are low tides. Learning how to read tide charts for inshore fishing comes down to one skill, reading the slope between those peaks, because the slope tells you whether water is moving in or out and moving water is what everything else depends on.
The chart mechanics take about ten minutes to pick up. The harder part is applying them: choosing the right station, accepting that your favorite spot is not the station, and folding in wind and weather before you commit a whole day to a spot.
Table of Contents
- What You Need
- Step-by-Step: How to Read Tide Charts for Inshore Fishing
- Step 1: Choose the Correct Tide Station
- Step 2: Read the Date, Time, and Units
- Step 3: Identify High and Low Tides on a Tide Chart for Inshore Fishing
- Step 4: Find the Best Tide Height and Timing
- Step 5: Add Wind, Weather, and Current Direction
- Step 6: Turn the Chart Into a Fishing Plan
- Common Mistakes
- Frequently Asked Questions
- What is the best tide for inshore fishing?
- Should I fish on a rising or falling tide?
- Does the moon phase matter more than the tide chart?
- How do I choose a tide chart station near me?
- Are high and low tides the same as strongest currents?
- What weather conditions should I check before fishing inshore?
- Conclusion
What You Need
Six things. Most anglers start with two of them and wonder why the chart keeps disagreeing with the water in front of them.
- A local tide station prediction. NOAA Tides & Currents publishes the official predictions for every U.S. reference station, and most commercial apps pull straight from it. Free, complete, and the one source serious anglers treat as the tie-breaker when an app disagrees with another app.
- The right date and time zone. Tide times are published in local standard time for the station, which means daylight saving can shift your whole plan by an hour without the chart changing at all.
- Units and the reference datum. Know whether heights are in feet or meters, and know the datum the station uses. Most U.S. coastal stations report height above Mean Lower Low Water, so a tide printed as 0.4 feet is not no water, it is a low number on a scale that never goes negative in normal conditions.
- The tidal range for the day. Range is the vertical difference between a high tide and the following low tide. It tells you how much water actually moves through your spot and whether the day can produce current at all.
- A marine forecast. Wind speed and direction, barometric pressure, and any recent rain. None of that is on the tide chart, and any of it can beat the prediction.
- Local knowledge of your water. Depth at low water, where the channels cut, which bayous drain first. A chart tells you when the water moves. Your own knowledge tells you where to stand when it does.
Step-by-Step: How to Read Tide Charts for Inshore Fishing
Before the steps, one distinction that causes most of the confusion. Tide height is the elevation of the water, printed in feet. Tidal current is the speed and direction the water moves at that height. A chart gives you the height; the current follows the shape of the curve. Maximum current does not happen at high or low tide, it happens roughly two hours before and after, in the steepest part of the curve.
Step 1: Choose the Correct Tide Station
Predictions are published for a reference station, not for your fishing spot. Pick the nearest station whose tidal behavior matches what you are fishing. A big open harbor or a coastal reference station is usually right for the open bay; an inlet, river mouth, or small exposed town is usually right for marsh and estuary water.
Forum anglers get this wrong constantly, then blame the chart. If two spots sit twenty miles apart and high water is nearly four hours apart at one of them, the station you chose is the problem, not the tide.
Step 2: Read the Date, Time, and Units
Confirm three things before you read anything else: the date you are actually fishing, the time zone the times are printed in, and whether heights are in feet or meters.
Two printed-table quirks trip people up. Blank cells mean there is no predicted turning point that day, often because a station gets only one high or one low in some tidal regimes. A column marked with a time after midnight that belongs to the previous evening catches out nearly everyone on a monthly table. Read the column header, not the row position.
Step 3: Identify High and Low Tides on a Tide Chart for Inshore Fishing
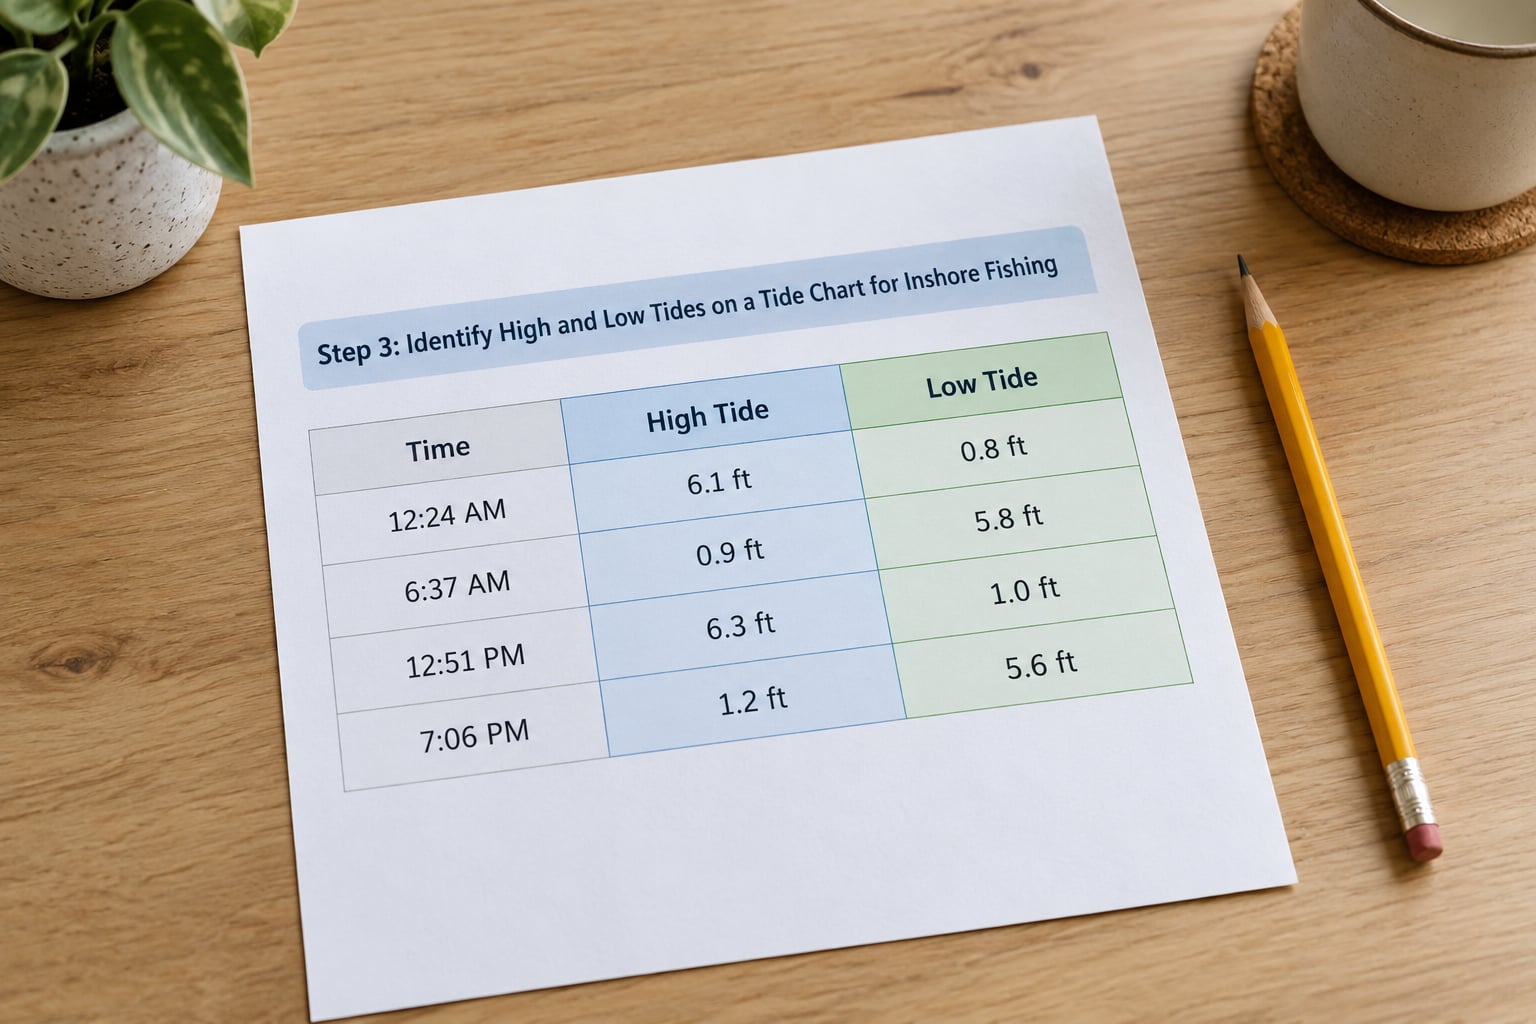
High tide is the peak of the curve, low tide the trough. Mark the times and heights of every turning point on your day, and then look at the slope between them. Water rising from a low to a high is a flood tide with current running shoreward. Water falling from a high to a low is an ebb with current running seaward.
The exact turning point matters less than most people think. It is the steep section on either side of it that produces current, and that is where you fish. If you only have time for one thing, mark the midpoint of the two steepest sections of the day and build around those.
Step 4: Find the Best Tide Height and Timing
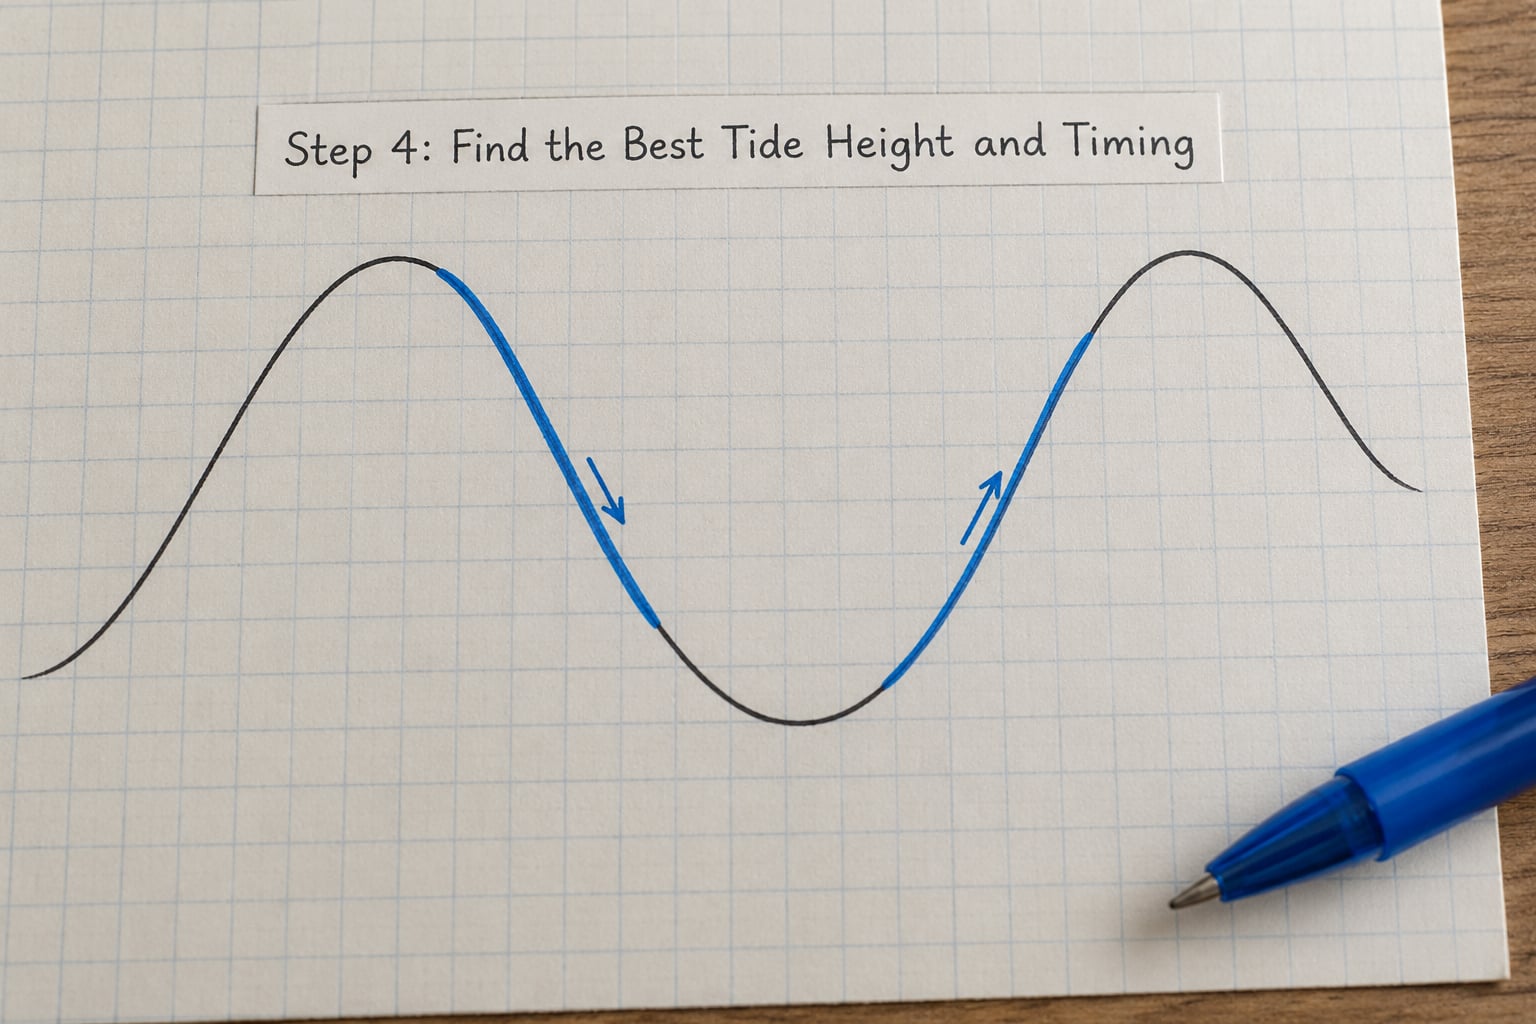
There is no universal best tide. There is a best tide for a given water type, and the chart plus your local knowledge give it to you.
The general shape of inshore fishing preferences:
- Flooding tide on shallow flats and grass edges. Rising water covers fresh ground, the drop-off edge moves toward you, and it is generally cooler, clearer, and better oxygenated than water that has been sitting in the sun all afternoon.
- Ebbing tide on jetties, inlet mouths, and pier pilings. Falling water concentrates bait that was spread over the flats and pulls it out through the narrow structure. This is where you catch fish on a falling tide.
- Moving water beats directional water. Experienced inshore anglers say it plainly: fish feed when water is moving, and they do not care much which way. Dead slack water is the condition to avoid, not low water by itself.
Use the rule of twelfths to judge how fast the water is moving at any hour. In the first hour after low water the current runs about one twelfth of the day’s maximum, in the second about two twelfths, then three, four, five, and six through the six hours to high water. That curve peaks in the middle, not at the ends, which is the same point the graph makes.
A second rule of thumb circulates as the 50/90 rule: maximum current runs roughly 50 percent of the way up the flood curve and 90 percent of the way down the ebb curve after high water. Treat both rules as approximations. They give you a shape, not a clock, and the shape is what you are fishing.
Step 5: Add Wind, Weather, and Current Direction
The chart predicts astronomical tide. It does not know about wind. Wind blowing onshore pushes water into bays and marshes and can add a foot or more of height on top of the predicted tide. Wind blowing offshore pulls water out and can leave a flat you planned to fish bone dry at mid tide.
Pressure matters the same way. A strong pressure change moves water out of or into shallow areas faster than the tide curve alone would suggest, and falling pressure with onshore wind is the classic setup for murky, blown-in water. Check a marine forecast, not a land forecast, because sea state and wind over the water is what shapes the estuary.
Direction is the last piece. An ebb current moving past a jetty on one side produces rips and seams, and the same ebb on the other side produces slack seams and eddies. Two anglers on the same tide at the same structure can be fishing completely different water.
Then sanity-check the chart against reality. Look at a tide staff, a dock piling with a growth line, or the waterline on a ramp. If the predicted flood is two hours out and the ramp is already under water, the wind or pressure beat the prediction, and your plan should change.
Step 6: Turn the Chart Into a Fishing Plan
Now put the pieces in order before you leave the house.
- Launch time. Set it so you arrive with water already moving rather than sitting on a flat watching it come in.
- Water depth. Compare the predicted low height with what you know about the spot. If the channel goes dry at the predicted low, you have a grounding problem and a tide you cannot fish, and you need an earlier start or a deeper water.
- Species and water type. Flats and edges want the flood, structure wants the ebb, a bay with wind-driven water wants whatever is actually moving that day.
- Tackle weight. If you are fishing when the current is predicted to be strongest, lighten your presentation or drop to the bottom. Fighting a 2 knot ebb with 8 pound braid is how a good tide turns into a lost fish.
- Return window. Plan to be back on the trailer before the predicted low, not near it. Predicted slack water can be off by up to 90 minutes, and sometimes closer to two hours, and nobody wants to find out at dark in a channel that just got shallow.
Common Mistakes
Every one of these shows up in the same handful of forum threads, usually within a few minutes of each other.
Using the wrong tide station. A big coastal port three hours away can be completely wrong for a small marsh creek. Pick the station whose tidal behavior matches your water, then expect an offset of up to a few hours at the actual spot.
Confusing tide height with current speed. Slack water is not high tide or low tide. Maximum current sits on the steep slope between them, so the strongest fishing is usually two hours either side of the turning points, not at them.
Ignoring the datum. Heights are measured above Mean Lower Low Water, the long-term average of the lowest tides. A negative number shows up in charts built on a different datum and does not mean below the sea, and knowing your datum is the difference between reading a number and knowing whether you can float over that spot.
Overlooking the time zone. Station times are published in local standard time. When daylight saving is in effect, the chart and your watch disagree by an hour.
Chasing one universally best tide. The rule that works on tidal flats inverts on a jetty. The rule that works in calm bays fails where wind sets the water. Attach the condition to the advice or throw it out.
Trusting the chart alone. Predictions do not include wind, barometric pressure, or river runoff. This is the single most common way a good plan falls apart on the day, and the fastest fix is a two-minute look at the ramp and the piling before you drive to the launch.
Assuming neap days are dead. A neap tide has a small range and weak current. It is a bad day to chase moving water, and it is a fine day to fish a still cove, a wind-blown point, or a bay junction where current converges from two sources.
Fishing the dead calm and expecting results. If you must choose between dead slack water and a hard breeze, hard breeze is usually the better option. Water pushed by wind still moves.
Frequently Asked Questions
What is the best tide for inshore fishing?
There is no single best tide for all inshore fishing. A flooding tide usually works best on shallow flats and grass edges because rising water covers new ground and carries bait onto it. An ebbing tide usually works best on jetties, inlet mouths, and pilings, where falling water funnels bait out of the flats. The condition that beats both is moving water of any direction, and the condition to avoid is dead slack water.
Should I fish on a rising or falling tide?
It depends on the water type you are fishing. Rising water is usually better on flats, marsh edges, and anything shallow, because it pushes bait onto newly covered ground. Falling water is usually better around structure such as jetty rocks, inlet mouths, and pier pilings, where the current concentrates and carries bait seaward. Pick the phase that matches your target spot rather than following a rule for the whole coast.
Does the moon phase matter more than the tide chart?
No. The moon phase is already built into the tide prediction. What it changes is the range, and that is why the chart is the better tool: new and full moon produce spring tides with the largest range and the strongest current, while quarter moons produce neap tides with little range and weak current. Check the predicted range on your date, and if it is small, plan for a sheltered spot instead of a current-driven one.
How do I choose a tide chart station near me?
Choose the nearest station whose tidal behavior matches the water you are fishing, not simply the nearest town. Open bay and sound fishing generally track the open coastal reference station, while marsh creeks, estuaries, and inside passages can be better served by an inlet or river mouth station. Predictions are published for the station, not your spot, so expect an offset of up to a few hours at the place you actually fish.
Are high and low tides the same as strongest currents?
They are close to the opposite. Slack water happens at high and low tide, when the water briefly stops moving, and maximum current happens on the steep part of the curve between them, roughly two hours before and after the turning points. As a rough guide, maximum current sits near the midpoint of the flood and the midpoint of the ebb. That is also why the best fishing is usually underway rather than at the exact peak.
What weather conditions should I check before fishing inshore?
Check a marine forecast rather than a land forecast. The things that change your trip are wind speed and direction, barometric pressure and whether it is rising or falling, and any recent heavy rain that has swollen what drains into your bay. Onshore wind raises the water inside a bay above the prediction, and offshore wind pulls it out, and either one can turn a planned water depth into a problem or a gift.
Conclusion
Start with the station, not the fish. Open the prediction for the local station that matches your water, mark the highs and lows, check the tidal range for the date, and plan to be on the water when the curve is steep rather than at the turn. Then layer on wind, pressure, depth, access, and a return window with margin, because the chart tells you when the water moves and nothing else does.